Reading
You have a tomato plant and you are trying to decide whether you should use fertilizer to help it grow.
For the first three weeks, you water the plant and count how many ripe tomatoes you pick each week. After three weeks, you decide to see if fertilizer will help your plant grow more tomatoes. For the next three weeks, you add fertilizer to the water. You count how many ripe tomatoes you pick each week.
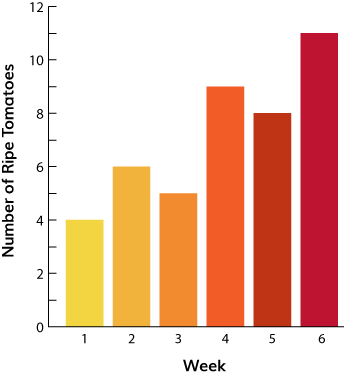
You want to know if the fertilizer is helping, so you make a bar graph to record your data. As you can see, the last three bars are taller than the first three bars. This means that the fertilizer has helped the plant to produce more tomatoes.

Now, you know it is worth it to buy fertilizer, because it gives you extra tomatoes!
Why is this important?
The bar graph shown above is a graphic organizer. A graphic organizer is a chart, table, or picture that helps us see numbers in a different way.


